> ## Documentation Index
> Fetch the complete documentation index at: https://docs.appsignal.com/llms.txt
> Use this file to discover all available pages before exploring further.
# Distributed tracing
> Follow one request across services and applications: how AppSignal assembles each service's subtrace into one trace.
Where does a slow request actually spend its time? A request takes four
seconds, but your web app looks normal and the database is quiet.
A single request can authenticate against one service, load data from an
internal API, enqueue a background job, and call a third-party payment API
before the response comes back. When it slows down or fails, the cause often
sits in a different service than the one that first showed the symptom.
Distributed tracing lets you follow that one request across those boundaries.
AppSignal groups the work from every service into one trace, so you can see the
full path before you start comparing timestamps across apps.
What is distributed tracing?
When each service reports on its own, you can see that a web action is slow,
but not that an inventory service farther down the call chain caused it. In
AppSignal, those services may live in separate applications or namespaces, so
following one request means opening each one and lining up the timestamps.
Distributed tracing keeps those services connected. As a request moves from one
service to the next, each service tags its work with the same trace identifier
and records which span called it. AppSignal uses that data to reassemble the
full path of the request across every service that took part.
With a distributed trace, you can:
* Follow one request from its entry point through every service it reached.
* See where the time went, even when the slow part runs in a different service
or application.
* Find which service an error started in, not just where it surfaced.
Spans, traces, and services
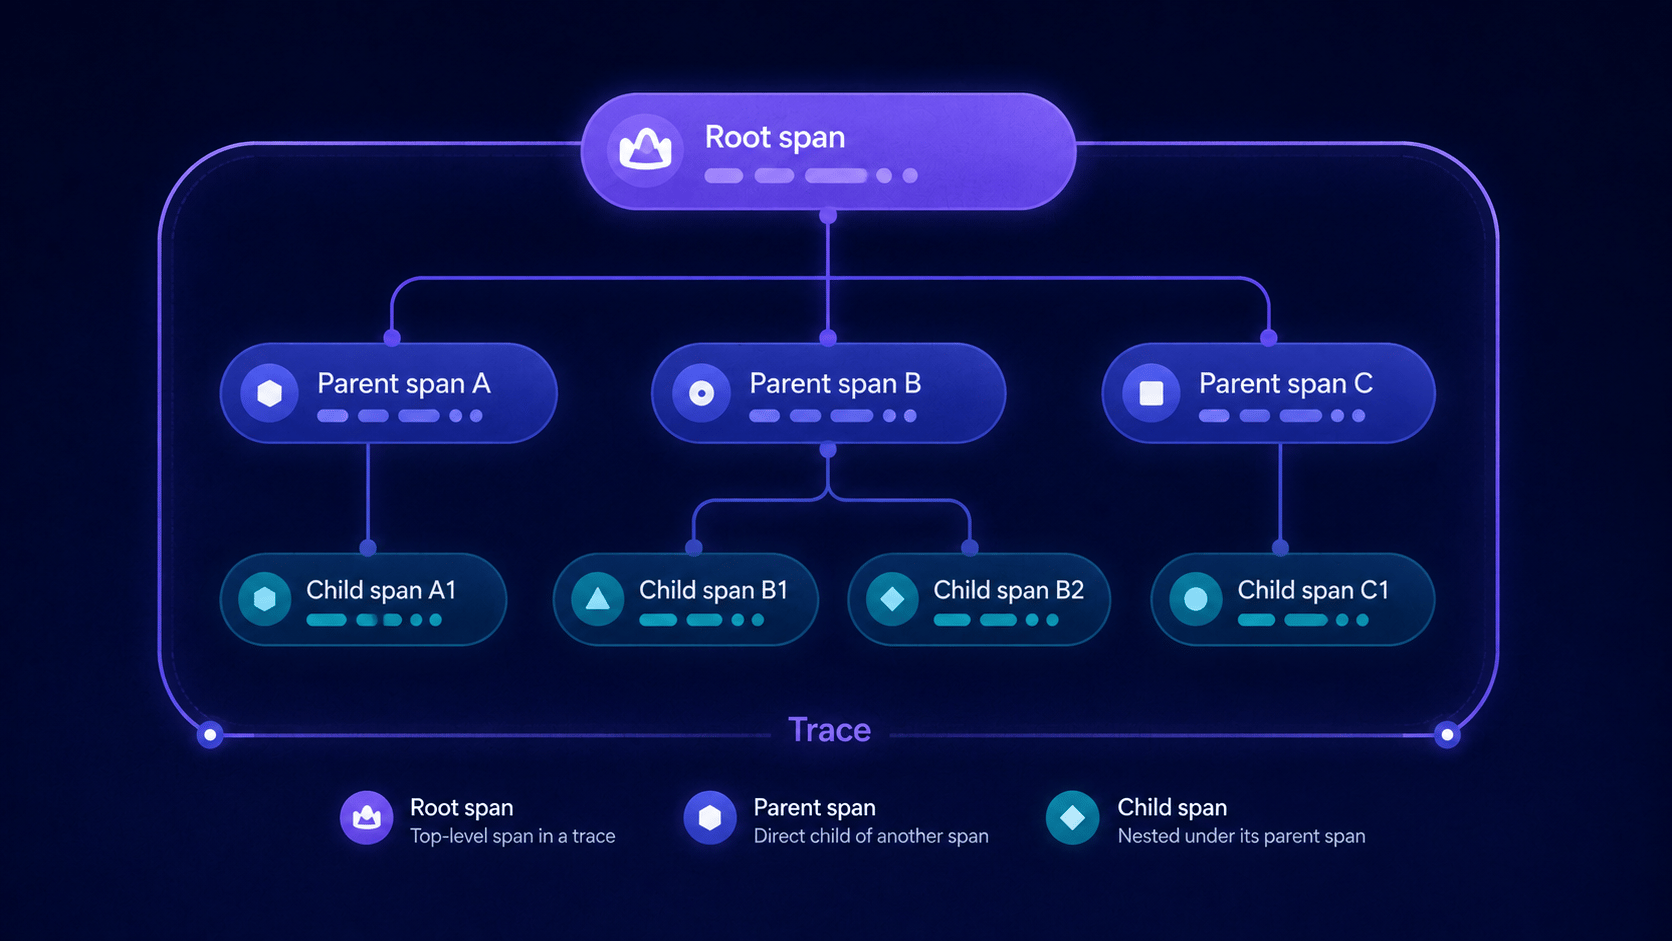
AppSignal shows a distributed trace as three building blocks.
* **Span**: a single unit of work, such as an incoming HTTP request, a database
query, a call to another service, or a block of code you instrument yourself.
A span has a name, a duration, and attributes, and it records the span that
started it. Spans are the smallest thing a trace is made of.
* **Trace**: all the spans that belong to one end-to-end operation. Because each
span knows its parent, the spans in a trace form a tree that describes the
request from start to finish.
* **Service**: a named component that takes part in a trace, such as a web app,
a background worker, or an internal API. You name a service with the
`service_name` option (or the `APPSIGNAL_SERVICE_NAME` environment variable), and
AppSignal uses that name to tell services apart in a trace. A single trace
usually crosses several services, and those services can report to different
AppSignal applications.
 AppSignal builds traces on top of OpenTelemetry, so these terms line up with
OpenTelemetry's. AppSignal groups each trace under an
[action](/appsignal/terminology#actions) and a
[namespace](/application/namespaces), based on the endpoint, job, or task the
trace belongs to.
Within AppSignal, a trace is a kind of
[sample](/appsignal/terminology#samples): the detailed record of one request,
stored so you can open it and read it span by span. AppSignal derives your
performance metrics, such as response time and throughput, from these traces, so
a performance chart and a single trace are two views of the same data.
AppSignal builds traces on top of OpenTelemetry, so these terms line up with
OpenTelemetry's. AppSignal groups each trace under an
[action](/appsignal/terminology#actions) and a
[namespace](/application/namespaces), based on the endpoint, job, or task the
trace belongs to.
Within AppSignal, a trace is a kind of
[sample](/appsignal/terminology#samples): the detailed record of one request,
stored so you can open it and read it span by span. AppSignal derives your
performance metrics, such as response time and throughput, from these traces, so
a performance chart and a single trace are two views of the same data.
Availability and setup
Before you investigate a request across services, each application needs to report to a hosted collector and identify itself with a distinct service name.
Distributed tracing is available through AppSignal integrations for Python,
Ruby, and PHP. Elixir and Node.js are not supported yet, but any
OpenTelemetry-instrumented application can still report trace data to a hosted collector.
Distributed tracing is a beta [AppSignal Labs](/labs) feature, **only
available** when using the AppSignal hosted collector.
What you need to configure depends on how your integration sends data to
AppSignal. Python and Ruby can report either through their bundled agent or
through a collector, so you need to enable collector mode. PHP and custom
OpenTelemetry setups already report through a collector, so there is nothing
extra to switch on for distributed tracing.
* **Python**: set the `collector_endpoint` option to your hosted collector's
URL rather than a self-hosted one. See
[collector configuration for Python](/python/configuration/collector).
* **Ruby**: set the `collector_endpoint` option to your hosted collector's URL
rather than a self-hosted one. Collector mode arrived in AppSignal for Ruby
5.0 and needs the `appsignal-opentelemetry` gem alongside it, on Ruby 3.1 or
newer. See
[collector configuration for Ruby](/ruby/configuration/collector) for the
versions to install, and [distributed tracing for Ruby](/ruby/distributed-tracing)
for the libraries that carry the trace for you.
* **PHP**: no extra distributed tracing setting to enable. The PHP package
already reports through a collector, so distributed tracing works once your
app reports to AppSignal.
* **A custom OpenTelemetry setup**: no AppSignal-specific distributed tracing
setting to enable. Exporting to a hosted collector is already how these
setups report, so traces connect on their own.
Set a service name for each application as well. Python, Ruby, and PHP take it
as the `service_name` option or the `APPSIGNAL_SERVICE_NAME` environment
variable; a custom OpenTelemetry setup sets the `service.name` resource
attribute. Set it explicitly for every service. Without it, AppSignal cannot
distinguish the services in a trace reliably, and custom OpenTelemetry expects
the `service.name` resource attribute to be present.
Distributed tracing is built on OpenTelemetry, so it is not limited to the
integrations above. Any OpenTelemetry-instrumented application can report
distributed tracing data to a hosted collector. You can do this through an
AppSignal integration such as the PHP package, or a [custom OpenTelemetry SDK
setup](/opentelemetry/installation).
Read more in the [Python collector configuration](/python/configuration/collector), [Ruby collector configuration](/ruby/configuration/collector), [PHP
configuration](/php/configuration), and [OpenTelemetry service name
option](/opentelemetry/configuration/options#service-name) docs.
How does it work in AppSignal?
AppSignal builds distributed traces on OpenTelemetry. The part that makes this
possible is **context propagation**. When an instrumented service calls another
service, OpenTelemetry attaches the trace identifier and the calling span to
the outgoing call. It travels as headers on an HTTP request, or as metadata on
a queued job, and the receiving service reads it and continues the same trace.
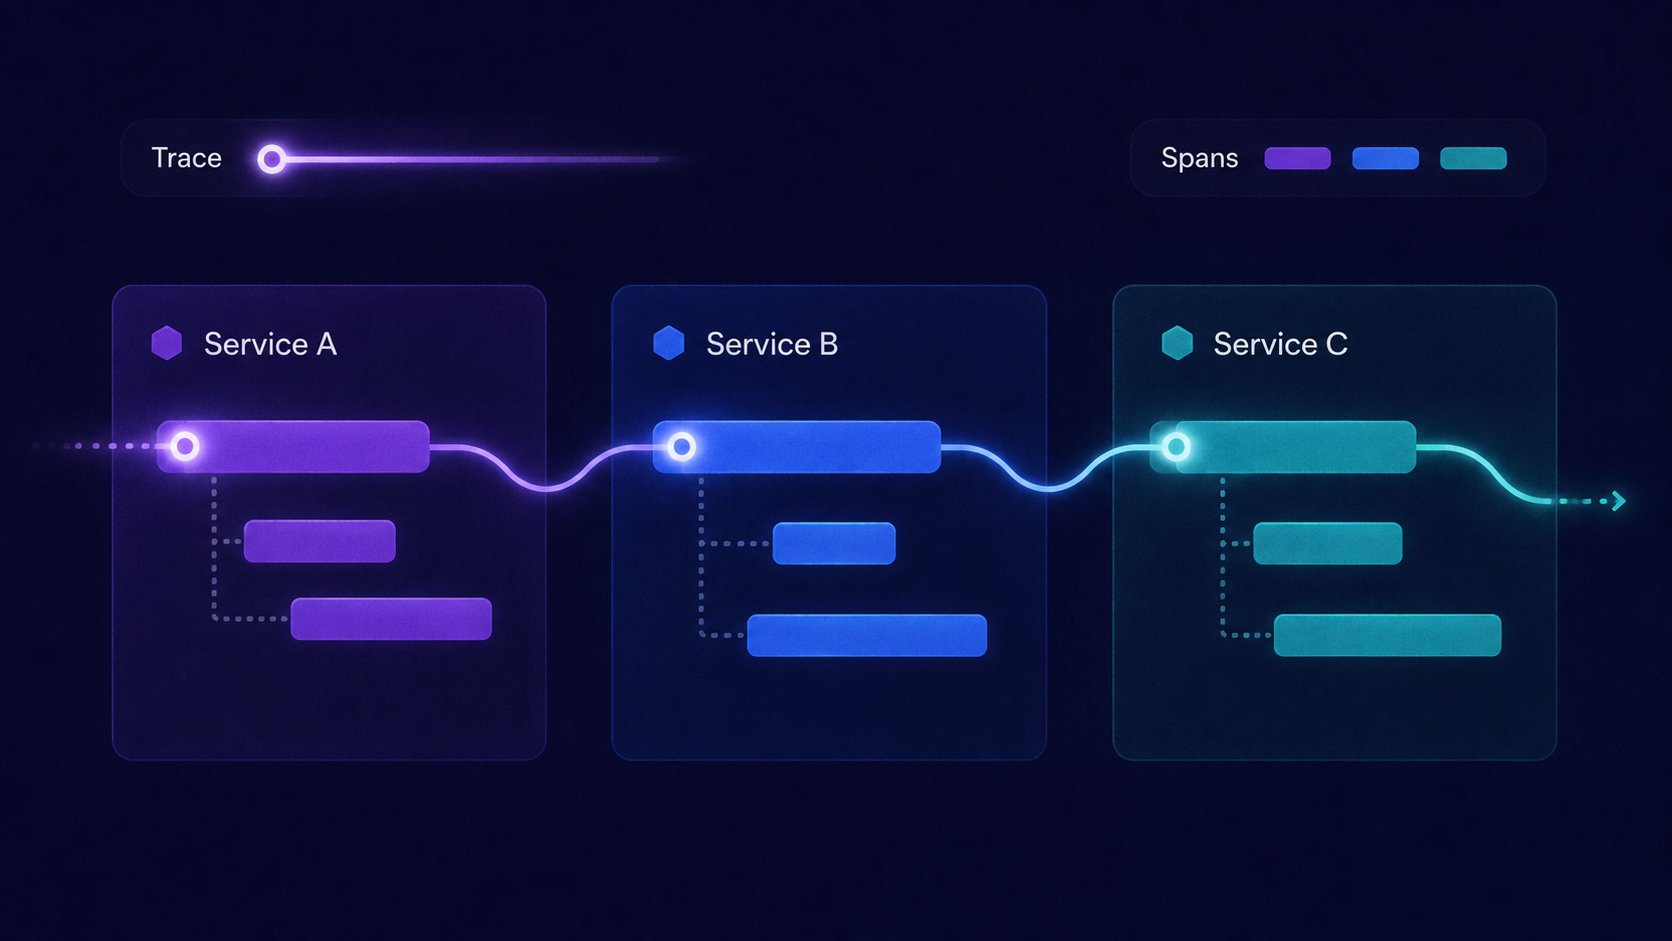
Each service reports the portion of the trace it handled, called its
**subtrace**. AppSignal receives these subtraces independently, often from
different processes or hosts, and reassembles them into one trace using the
shared trace identifier and the parent and child links between spans. You do
not connect services together in AppSignal by hand. If a library is
instrumented, its calls join the trace automatically.
 AppSignal samples traces rather than keeping every one, and it makes that
decision across services: when a trace is kept, the work from every service in it
is kept too, so the trace arrives whole instead of as scattered fragments.
Sampling favors the traces you most want to see, the ones with errors and the
slowest requests. Gaps can still appear at the edges, when a service does not
report or its data arrives too late.
After traces start arriving, open the [trace page](/trace-page) to inspect them
in two ways: the **service map**, which shows the services in the trace and the
calls between them, and the **trace timeline**, which lays every span out over
time. The trace page covers how to read both.
AppSignal samples traces rather than keeping every one, and it makes that
decision across services: when a trace is kept, the work from every service in it
is kept too, so the trace arrives whole instead of as scattered fragments.
Sampling favors the traces you most want to see, the ones with errors and the
slowest requests. Gaps can still appear at the edges, when a service does not
report or its data arrives too late.
After traces start arriving, open the [trace page](/trace-page) to inspect them
in two ways: the **service map**, which shows the services in the trace and the
calls between them, and the **trace timeline**, which lays every span out over
time. The trace page covers how to read both.
Cross-application support
A service in AppSignal is not the same thing as an application. Several services
can report to one AppSignal application, and a single trace can also cross
services that belong to entirely separate applications.
For example, a web app, an inventory service, and an audit service might all
report to one AppSignal application, each under its own service name, while a
separate service reports as its own application. A single user action, such as a
checkout, can produce a trace that includes services from both applications.
AppSignal's service map treats this as one trace regardless of where each
subtrace was reported. It resolves the application that owns each service and
links each one to that application's view of the same trace. To follow a
request across an application boundary, select the next service on the map. You
move from one application to the next along the same trace.
This works because context propagates across process and application boundaries
the same way it does between services, and AppSignal matches subtraces by their
shared trace identifier, not by which application or host they came from.
Once each service reports through a hosted collector with its own service name, you can follow one request across services and applications from a single trace.
Open one stored trace and read its service map, timeline, span details, related logs, and triggers.
See which Ruby HTTP and background job integrations carry the trace automatically.
Set up a custom OpenTelemetry SDK to report through an AppSignal collector.
Add your own spans and attributes when the default instrumentation is not enough.
Connect a trace to its related logs so you can move between them while debugging.
Try out distributed tracing and other experimental features.
This documentation is built and hosted on [Mintlify](https://mintlify.com), a developer documentation platform.