
How AppSignal groups errors
When your application reports an exception, AppSignal groups it into an issue with other occurrences of the same error type on the same action and namespace. A single bug that fires thousands of times becomes one issue to triage, not thousands of separate alerts. Each issue keeps a set of traces: representative occurrences with the full backtrace, request metadata (such as hostname, revision, and request path), and any tags you add.See the errors a deploy introduced
The Pick a revision filter on the errors page allows you to scope the errors list to a deploy or a timeframe. Open it to choose a scope, such as By Revision (deploy), or By Timeframe, which covers a time range.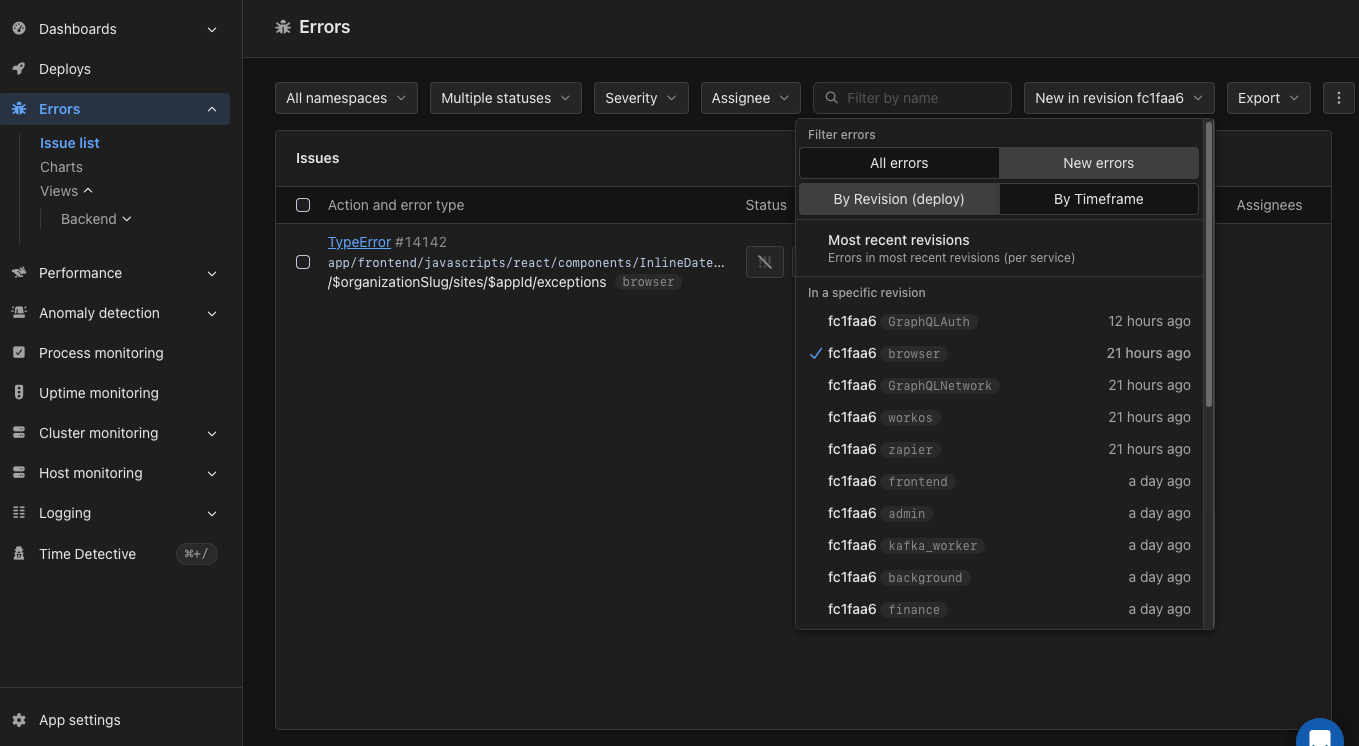
The errors filter with New errors selected and one revision chosen
- Most recent revisions: errors first seen since the most recent revisions per service.
- A specific revision: errors first seen in that deploy.
- A timeframe: errors first seen within that time range. Pick a start and end time, or choose a preset like Last 24 hours or Last 7 days.
new_only parameter of the get_exception_incidents tool.
Triage and notifications
Each issue can be assigned to a team member, given a state and a severity, and configured with its own notification settings. AppSignal notifies you through your configured channels (email, Slack, and other integrations) when a new error is detected.Namespaces
Errors are grouped by namespace, so you can separate web requests from background jobs. The default namespaces are Web and Background, and you can configure custom ones. See Namespaces for details.Alerting on error rates
Beyond per-error notifications, anomaly detection can alert you when the error rate for an application or namespace crosses a threshold you set.Reporting handled exceptions
If you catch an exception yourself, you can still report it to AppSignal with the helper methods provided by your SDK. The exact helper names vary by SDK, but the goal is the same: keep the error attached to the trace, or send it with useful context.- Ruby:
report_error,set_error, andsend_error - Elixir:
Appsignal.set_error/2andAppsignal.send_error/3 - Node.js:
setError()andsendError() - Python:
set_errorandsend_error - PHP: Exception handling
- Front-end JavaScript: Error handling
Add debugging context
To make errors easier to investigate, add more context with:See also
- The Ruby debug gem: breakpoints, stepping, and the stack: use the Ruby
debuggem to inspect a problem while reproducing it locally. - params.expect: strong parameters in Rails 8: Rails 8 adds
params.expectto permit and require parameters in one step. It rejects unexpected parameter shapes as bad requests.